
You will need to have Adobe Acrobat Reader installed to view the UFO articles. Download it from here.
Articles
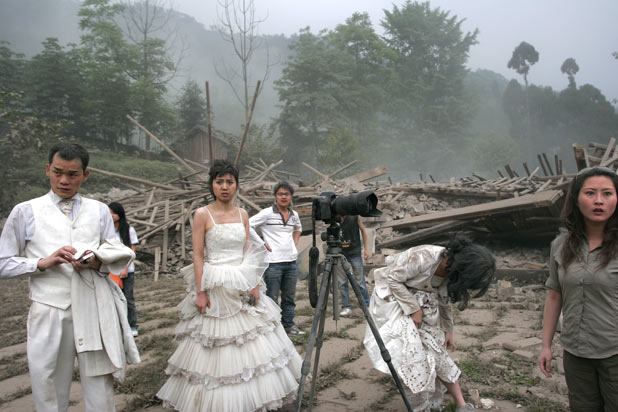
Dreams and disaster happening at the same time.


Dr. Antonio de Nicolas' brother has just been elected the 30th Superior General of the Society of Jesus! History is made! Click here.
New superior urges Jesuits to strengthen service to poor. Click Here
Province Express - Father Adolfo Nicol�s. Click Here
- Is a New Eugenics Afoot? by Garland E. Allen
- The 1929 Arab Terror Attack: When Hebron Became Occupied Territory by Sammy Benoit
- "Saturn enters Libra"
- 'I am sorry,' Cardinal Mahony says amid new priest abuse details
- 04/07/08 We are all African
- 04/23/08 Moody's Blues
- 05/06/08 Lunacy and Freedom
- 05/10/08 It's not easy being Green, or even truthful it would seem
- 05/21/08 Shareholder Value
- 05/26/08 Senator Clinton, Fear, and Assassination
- 06/02/08 The Lesson Derived From Derivatives
- 06/12/08 The Price of Ice Cream
- 06/23/08 The Market
- 06/25/08 Getting Hit By A Bus
- 07/11/08 Being Right
- 07/18/08 Einstein
- 07/18/08 Karma
- 07/21/08 Ecology, Security and Economics
- 08/01/08 Who We Have Been Waiting For
- 08/11/08 From The Head To The Heart
- 08/20/08 Incarceration
- 08/28/08 Frick and Frack
- 09/10/08 Worrying
- 09/17/08 Taxpayer Bailout
- 10/16/08 Deleveraging
- 11/23/08 Too Big to Survive
- 11/24/08 Getting Hit By a Bus
- 2014: Sag New Moon --Change that perspective-NOW!
- 2024 Capricorn New Moon: Let's Get Your Cap On!
- 2nd Aquarius New Moon: 2015
- ACE OF CUPS
- ACE OF PENTACLES
- ACE-OF-SWORDS
- ACE-OF-WANDS
- After Lehman
- Amazing New Video -- The 2012 Enigma! by David Wilcock
- An Extraordinary Astrological Recapitulation by Brian McNaughton
- And now it is the Second Cancer New Moon!
- Aqaurius New Moon 2011--The New Quilting BEE!
- Aquarius New Moon 2010! It is a strange trip
- Aquarius New Moon 2012!
- Aquarius New Moon 2014 - You LikeMind me.
- Aquarius New Moon 2015 - The Zero One
- Aquarius New Moon 2016: Get Your Tribe On
- Aquarius New Moon 2017: Out of the chaos we find our Peeps.
- aquarius New Moon 2017: Out of the chaos we find our Peeps.
- Aquarius New Moon 2017: Out of The Chaos We Find our Peeps!!
- Aquarius New Moon 2018: Friends & Communities
- Aquarius New Moon 2019: No Time or Place for Emotions
- Aquarius New Moon 2020: Expect the Unexpected
- Aquarius New Moon 2021 Your Place in the Community
- Aquarius New Moon 2022: Loneliness or Circles? Your choice!
- Aquarius New Moon 2023: Wear Your Weird
- Aquarius New Moon 2024: Pluto is Getting Our Attention
- Aquarius New Moon 2025
- Aquarius New Moon--Unique Solutions if you are willing
- ARCHANGEL MICAHEL: SOUL'S JOURNEY
- ARCHANGEL MICHAEL: FAMILY AND FRIENDS
- Archangel Michael: INTENTIONS
- ARCHANGEL URIEL: STRESS
- Archangels: Stress
- Aries New Moon #1 March 2023
- Aries New Moon #2 - April 19th 2023 PDT
- Aries New Moon - It will be a great Treasure Map time!
- Aries New Moon 2009---IT’S A BIG ONE!
- Aries New Moon 2010--Let's get this party started!
- Aries New Moon 2012: You rule!
- Aries New Moon 2014 Get out of the way! Your Life is Coming
- Aries New Moon 2016: Light this rocket!
- Aries New Moon 2017
- Aries New Moon 2018: What Are Your Instincts Telling You?
- Aries New Moon 2019: Patience. Yes. That Word.
- Aries New Moon 2020: Survival
- Aries New Moon 2021: Heart Driven Changes
- Aries New Moon 2022: Finding Self Now!
- Aries New Moon 2024 Total Solar Eclipse - Wow.
- Aries New Moon 2025: A New Beginning for All
- Aries New Moon! (2008) by Tracy Cook
- Aries New Moon, 2011- Yes it is a big one!
- Article by Jock Brocas
- Back on Uncle Sam's Plantation
- Being Frugal and Benefiting
- Biomass-Eating Military Robot Is a Vegetarian, Company Says
- Bob Dylan: Like a Complete Unknown by Ron Radosh
- Books mentioned in Brian Hurst's broadcasts
- Britain Hired Astrologer to Fight Hitler
- Buddhism and the End of Economic Growth by John Stanley & David Loy
- Cancer Eclipse & New Moon 2019: Your Emotions Will Guide You
- Cancer New Moon & The Grand Cross
- Cancer New Moon --The Great Healing by Tracy Cook
- Cancer New Moon 2010---Your feelings have answers
- Cancer New Moon 2012 - "It's the flow, Baby!"
- Cancer New Moon 2014: REFRESH!
- Cancer New Moon 2016: Let It Flow
- Cancer New Moon 2017: Are your emotions flowing? Good.
- Cancer New Moon 2023: Ride the Rapids
- Cancer New Moon 2024: Emotions, Feelings and Needs- Oh, My!
- Cancer New Moon Solar Eclipse June 20, 2020
- Cancer New Moon--The first of two (2009)
- Cancer New Moon-Ready, Set, Emote! July, 14th 2007 by Tracy Cook
- Cancer New Moon: 2013
- Cancer New Moon: 2022 - Emotions Guide Us To Our Heart
- Cancer New Moon: Don't make me go find your roots...you do it!
- Cancer New Moon: Feelings. Emotions. Passion. 2021
- Cancer Solar Eclipse 2018
- Capricorn 2010 NEW MOON--Taking Care of Business!
- Capricorn 2011-Aim your ambition-NOW
- Capricorn New Moon - Get Serious!
- Capricorn New Moon 2011 -Be the authority and move up!
- Capricorn New Moon 2013: Pragmatic and no excuses
- Capricorn New Moon 2014
- Capricorn NEW MOON 2016 ...Get Real!
- Capricorn New Moon 2018
- Capricorn New Moon 2019 - Pragmatism Pragmatism Pragmatism
- Capricorn New Moon 2019: Focused and Disciplined
- Capricorn New Moon 2019: Focused and Disciplined
- Capricorn New Moon 2021. Climb Like a Goat
- Capricorn New Moon 2022: Climb Heights
- Capricorn New Moon 2025 Ambition for You
- Capricorn New Moon Dec 2022: CEO of Values
- Capricorn New Moon: Slow and sensible is a-okay.
- Children Skipping Childhood
- Clean your Slate Capricorn New Moon! by Tracy Cook
- Compliments Do You Get Enough Of Them?
- David Kaiser from MIT, not David Kaiser from the Naval War College
- Detach From Rescuing
- Did Yale prostitute itself for oil money? by Ethel C. Fenig
- Do I Remember Differently Than Another Does?
- Do you feel good about where you live? by Jill Saint James
- Dreaming on Pisces New Moon by Tracy Cook
- ECSTASY
- Energetic Health Food By Eva Sanchez,N.D.
- Face The Music
- Fox Blowviator Bill O'Reilly wants you to hate him
- GEMINI NEW MOON 2011 –“Can someone turn on the air, please?”
- Gemini Eclipse New Moon 2021: Fact versus Fiction and Pivot !
- Gemini New Moon (2012)- Second time's the charm
- Gemini New Moon 2009---The Fast and Furious Talker
- Gemini New Moon 2010: A Tornado among us!
- Gemini New Moon 2013
- Gemini New Moon 2014: The power of light feet
- Gemini New Moon 2014: The power of light feet
- Gemini New Moon 2018 - Thoughts!
- Gemini New Moon 2019: Mix it up & Adapt
- Gemini New Moon 2020: Reboot Your Inner Computer
- Gemini New Moon 2022: Process the Information
- Gemini New Moon 2023: Fuzzy Data But Still Informs
- Gemini New Moon 2024: Cha-Cha-Cha-ing
- Gemini New Moon by Tracy Cook
- Gemini New Moon-- Reach out! Mix it Up!
- Gemini New Moon--the first round- 2012
- Gemini New Moon. Mental Exercises 2015
- Gemini New Moon. Mental Exercises 2015
- Gemini New Moon: Question and Shift
- Gemini- New Moon 2008-- Ready to Connect! by Tracy Cook
- Get out of the way---LEO NEW MOON is HERE!
- Get your Viking on--Aries New Moon 2013
- Getting the Scoop by Janet Donovan
- Glossary of Number Values
- God + Faith by Margaret Wendt
- God Heard The Need
- Headaches are Telling You Something by Eva Sanchez, N.D.
- Heart Ethics by Way of Introduction by Dr. Antonio T. de Nicolas, PHD
- Hi Ho Silver!!
- History Unfolding by David Kaiser
- How American corporate philanthropies launched a national campaign of ethnic cleansing in the United States, helped found and fund the Nazi eugenics of Hitler and Mengele — and then created the modern movement of "human genetics." by Edwin Black
- How to sit with a medium
- I Forgot To Accept The Things I Can Not Change
- I Want Your Help, I’m An Atheist
- In a generation or two, the US will ask itself: "Who lost Europe?"
- In fallout from crisis, rethinking risk and human judgment by Lynnley Browning
- Incredible information and facts about the paranormal and publishing
- Is A Shift Needed in Parenting Values?
- Is Your Community Antisocial?
- It is all a balancing act, Baby! Libra new moon 2008
- Jess Stearn
- JFK Junior - John Jr. by Sloan Bella
- Jon Bennett Ramsey by Sloan Bella
- Keeping a Tally Sheet
- Kurt Cobain - Celebrity Channel by Sloan Bella
- Learn about Boundaries
- Lemon for Lymph By Eva Sanchez N.D.
- LEO 2008 New Moon--Sunny side of the street by Tracy Cook
- Leo New Moon - Round two & Solar Eclipse 2017
- Leo New Moon - The First One! 2017
- Leo New Moon - The First One! 2017
- Leo New Moon - To be bold or not to be bold? That is the question
- Leo New Moon 2011--Your passion tells you so
- Leo New Moon 2012--The Heart Wants To Thrive
- Leo New Moon 2013: Be Big. Be Very Big
- Leo New Moon 2015: Learn from the Lion!
- LEO NEW MOON 2016: Dare to find Joy & Strength
- Leo New Moon 2019: Be Special, dang it!
- Leo New Moon 2020: Put on Your Sloppy Cape
- Leo New Moon 2023 - 29 Days of Brave
- Leo New Moon 2024: Love, Strength and Courage
- Leo New Moon Eclipse 2018
- Leo New Moon: 2021 - Find Your Authentic Heart
- leo New Moon: 2021 - Find Your Authentic Heart
- Leo New Moon: 2022 - Be YOU.
- Leo's in the House..Roar! Sort of.. by Tracy Cook
- Libra New Moon (2007) by Tracy Cook
- Libra New Moon -How do you relate? Does it serve you?
- Libra New Moon 2009--The business of relating
- Libra New Moon 2012-
- Libra New Moon 2013 -- Balance That!
- Libra New Moon 2014: Let's really get our Libra on this time
- Libra New Moon 2015: Get your relationships straightened out
- Libra New Moon 2016: The Power of Negotiation
- Libra New Moon 2017: Not as light as you think
- Libra New Moon 2018: Power & Negotiations & Self Worth. Repeat.
- Libra New Moon 2019: Your Identity, My Identity & An Oxygen Mask
- Libra New Moon 2020: Bumpy. Power. Kindness. Repeat.
- Libra New Moon 2021: Where's your balance?
- Libra New Moon 2022 : How are your relating skills?
- Libra New Moon Eclipse 2023
- Libra New Moon Eclipse 2024: What's That Zagging?
- Look In My Eyes
- Love in the Land of Loneliness by Joseph Dispenza
- Marilyn Monroe - June 2004 - Celebrity Channel by Sloan Bella
- MAY GOD BLESS THIS AIRLINE CAPTAIN
- Me Controlling
- Meditation: The Making of Images By Antonio T. de Nicolas, PhD
- Mindy Sommers
- Mirror Mirror On The Wall
- My Global Warming Epiphany by Randall Hoven
- Narcissistic Behavior Is Increasing
- Neediness
- Nevins Rules by Julie Salamon
- New Moon in Aquarius 2013 Pull out your lightening rod-hits are coming
- New Moon in Virgo--Now you can fix your life
- New Moon Leo 2010--Wish upon a star--"Hey, that's me!"
- No One Mention The War!
- Pass The Buck
- Patience is a Virtue
- Pisces 2021 New Moon - All We Need is Love
- Pisces New Moon 2010--The LEAP of FAITH
- Pisces New Moon 2012: What is Dissolving?
- Pisces New Moon 2013 -Get in the flow
- Pisces New Moon 2014: Go for the Flow
- Pisces New Moon 2015
- Pisces New Moon 2016: Karma and Elevation
- Pisces New Moon 2017 -- The Big Release and Melt
- Pisces New Moon 2018: Intuition Speaks Are You Hearing It?
- Pisces New Moon 2019: Dazed and Confused --Thank You For It
- Pisces New Moon 2020: Time to Get Quiet
- Pisces New Moon 2022: Finding the Inner World
- Pisces New Moon 2023: Beep!
- Pisces New Moon 2024: Connecting to Bigger
- Pisces New Moon 2025: Unplug and Replenish
- Pisces New Moon---Mystics Apply
- Pisces New Moon--Dive or wash up on shore, it is your choice!
- Private Space Is Healing
- Psychic portraits of the Bangs Sisters
- Psychics, Mediums, and Rock N Roll
- Raymond Moody
- Re-wounding
- Re: Mars turns retrograde as Jupiter conjuncts Neptune on the Winter Solstice
- Re: Planetary Forecasting Methods for Traders
- Re: Saturn turns retrograde; Solar Eclipse; Mercury turns direct; Jupiter enters Pisces
- RESPOND TO RESPONSIBILTY-CAPRICORN NEW MOON 2008
- Responsibility Came From Being Told No
- Robert Monroe
- Sag New Moon 2010-- Ready, Aim---Change!
- Sag New Moon 2012 - A time to get real
- Sag New Moon 2021 Total Eclipse
- Sag New Moon 2023: Bits of Joy is still Joy
- Sag New Moon Total Eclipse 2020: The Truth is in The Mirror
- Sag New Moon---All Vision without the Hype!
- Sagittarius New Moon 2009--Ready, Aim, Adjust...Fire, Adjust, Aim, Ready..
- Sagittarius New Moon 2013 - Forward Ho!
- Sagittarius New Moon 2015: The Adventure!
- Sagittarius New Moon 2016: Get Wise Get Inspired
- Sagittarius New Moon 2017 - On Top of The Galactic Center
- Sagittarius New Moon 2018 - Get Inspired. Now!
- Sagittarius New Moon 2019: Hot & Cold Wisdom
- Sagittarius New Moon 2024: Finding The Way
- Sagittarius New Moon--Mother Knows Best
- Scorpio New Moon (2017) : Act Like a Plumber!!
- Scorpio New MOON 2009-Resources and Community--Where do I fit?
- Scorpio New Moon 2010-Jump in the water!
- Scorpio New moon 2012: Suit up and Commit
- Scorpio New Moon 2015
- Scorpio New Moon 2016: Release the death grip
- Scorpio New Moon 2018 - Rejuvenate!
- Scorpio New Moon 2019 - Shocked to Vulnerability
- Scorpio New Moon 2020: Dig Deep & Get Rid of Debris
- Scorpio New Moon 2023: Depth & Release
- Scorpio New Moon 2024: Tapping Power & Getting Unstuck
- Scorpio NEW MOON by Tracy Cook
- Scorpio New Moon Solar Eclipse SHED! SHED!SHED!
- Scorpio New Moon(2011)--DNA, Survival and ditching Garbage
- Scorpio New Moon: Get Your Plumbers Butt On!
- scorpio New Moon: Get your Plumbers Butt on!
- Scorpio New Moon: Solar Eclipse 2014
- scorpio New Moon: Solar Eclipse 2015
- Scorpio Solar Eclipse New Moon 2022: Release. Got it?
- Second Cancer New Moon 2020
- Sharia rejects all fundamental premises
- Speaking From Experience
- Speech by Lou Pritchett
- SURE RELATIONSHIPS BITE--BUT WE'RE ALL HUNGRY. Libra New Moon 2010
- Taurus New Moon 2008!
- Taurus New Moon 2010-----And so we begin.......
- Taurus New Moon 2011--Build upon it!
- TAURUS NEW MOON 2012 --What do you value?
- Taurus New Moon 2017: Practicality for a Personal Revolution
- Taurus New Moon 2018: Making Changes Bit by Bit
- Taurus New Moon 2019: Feel The Changes
- Taurus New Moon 2020: The rest of the year and being practical
- Taurus New Moon 2021. Slow down and find your values.
- Taurus New Moon 2022: Our Resources, our Love our Values!
- Taurus New Moon 2024: The Power of Slowing Down
- Taurus New Moon Eclipse: Yes you can make the changes!
- Taurus New Moon. Getting Practical ..Seriously, for real
- Taurus New Moon: May 19 The Glory of Practicality!
- Taurus New Moon: 2025 - Finding Stability In Extraordinary Times
- Taurus New Moon: Take the short route between A&B
- Taurus to the RESCUE!
- TaurusNewMoon 2014--Building Good bit by bit
- The Alinskyite's Big, Fat Governance Failure by Kyle-Anne Shiver
- The collapse of the U.S. Dollar and Federal Reserve? by Ted Phillips
- The coming collapse of the U.S. Dollar and Federal Reserve?
- The Consoling Angel by Antonio de Nicolas
- THE EMPEROR
- THE EMPRESS
- THE FOOL- MAJOR ARCANA
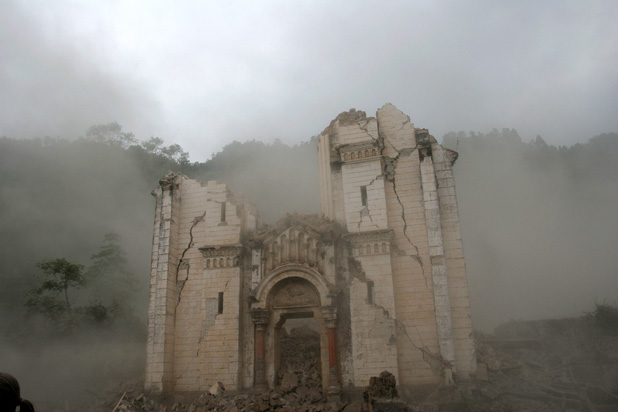
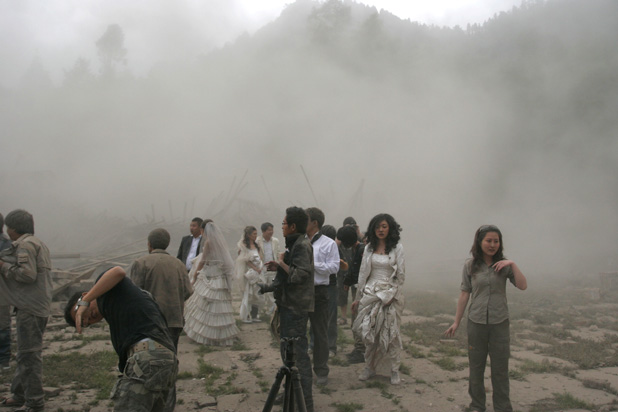
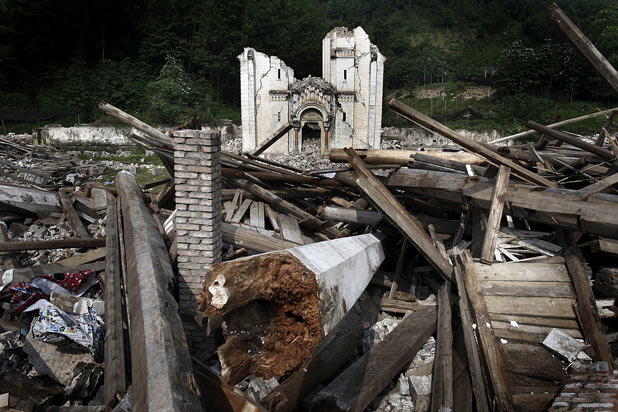
- The Ghosts on Moaning Mountain
- THE HEIROPHANT
- THE HIGH PRIESTESS
- The Horrifying American Roots of Nazi Eugenics by Edwin Black
- THE MAGICIAN- MAJOR ARCANA
- The Most Important Astrological Chart for Your Financial Security
- The Nightmare of Rationing in Oregon by Jeff Emanuel
- The Price of Ice Cream by Bill Sharon
- The Promise of the Past by Betty J. Kovács, Ph.D.
- The Reincarnation of Edgar Cayce and His Soul Group? - You Decide.
- The Sea has changed---SCORPIO NEW MOON 2008
- The Shadow and Karma
- The Spiritual Candle
- The Thieves of Happiness
- There she blows!!! SAG NEW MOON is HERE! by Tracy Cook
- Thomas Edison's Paranormal Personality by Margaret Wendt
- Thomas J. Curry must Leave Santa Barbara
- Tick Tock Virgo New Moon Strikes the Clock....2008
- Time To Connect With Like Minds
- Too Much Of A Good Thing....Is It Really Wonderful?
- Treasure Mapping by Tracy Cook
- Verbal Abuse Hurts
- Virgo 2018 New Moon - A Hero's Journey
- Virgo 2019 New Moon - A Car Full of Nerves
- Virgo New Moon - Your daily life is YOU. How is it going?
- VIRGO NEW MOON --GET YOUR MICRO ON!
- Virgo New Moon 2011- Help & Work serve you!
- Virgo New Moon 2012: Sweating the Small Stuff
- Virgo New Moon 2013: A Big Opportunity
- Virgo New Moon 2016 - What's that stuff in your schedule?
- Virgo New Moon 2017: Skills Needed! Please Apply
- Virgo New Moon 2021: Daily efforts build your life
- Virgo New Moon 2022: Don't be a burnt out Roomba
- Virgo New Moon 2023: Keep Your Head Down & Do The Work
- Virgo New Moon by Tracy Cook
- Virgo New Moon--Details Rule
- Virgo New Moon: 2020 - Every choice is yours
- Virgo New Moon: 2024 - Control Your Future By Your Schedule
- Vowels by Jill Saint James
- What Does Cutting Back On Expenses Mean To You?
- What Is A Distraction?
- What To Do This Taurus New Moon by Tracy Cook
- Where have all of the leaders gone? by Lee Iacocca
- Who Has Time To Read?
- You Feel Their Pain
- You had me at Hello, Aquarius New Moon by Tracy Cook
- You Lose Out When You Judge a Book by Its Cover
- You Make The Choice I Don't Care
- ‘Transce-end’ the trance – Bring out your dead!
- Uri Geller
- Margaret and Joel
- Houdini
Letters Sent to Us from the Public
- The 1929 Arab Terror Attack: When Hebron Became Occupied Territory by Sammy Benoit
- Biomass-Eating Military Robot Is a Vegetarian, Company Says
- Bob Dylan: Like a Complete Unknown by Ron Radosh
- Buddhism and the End of Economic Growth by John Stanley & David Loy
- David Kaiser from MIT, not David Kaiser from the Naval War College
- Did Yale prostitute itself for oil money? by Ethel C. Fenig
- History Unfolding by David Kaiser
- My Global Warming Epiphany by Randall Hoven
- The Alinskyite's Big, Fat Governance Failure by Kyle-Anne Shiver
- The collapse of the U.S. Dollar and Federal Reserve? by Ted Phillips
- The Nightmare of Rationing in Oregon by Jeff Emanuel
- Where have all of the leaders gone? by Lee Iacocca
Articles by Joel Martin
- Through the Eyes of a Skeptic
- Question and Answers
- Who Believes in the Paranormal?
- Nancy Reagan
- Ghost Ship
- I'm gonna get you 'suckers'
- Margaret Wendt and Joel Martin's New Book
Articles by Margaret Wendt
Paper Media: click thumb (where applicable) for full size image/.pdf files

Margaret's Magazine 1
Margaret's Magazine 2
Margaret's Magazine 3
Margaret's Magazine 4
Margaret's Magazine 5
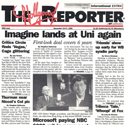
News Anchor's
UFO experience
My Favorite Martian
Article by M. Wendt
Robert Urich
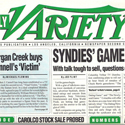
Spirit Magazine
The Healers Magazine
Entertainment Tonight
Magazine for Cleveland


- News Anchor's UFO Experience by Margaret Wendt
- My Favorite Martian by Margaret Wendt
- Looking for Love by Margaret Wendt
- God + Faith by Margaret Wendt
- Thoms Edison's Paranormal Personality by Margaret Wendt
- Margaret and Joel
- Who was Hayim Solomon?
- Nevins Rules by Julie Salamon
- Psychic portraits of the Bangs Sisters
- Psychics, Mediums, and Rock N Roll
- The Ghosts on Moaning Mountain
- The Spiritual Candle
- Thomas Edison's Paranormal Personality by Margaret Wendt
- Margaret Wendt and Joel Martin's New Book
My Global Warming Epiphany by Randall Hoven
Global warming is a complicated subject. It therefore takes a lot of hubris or ignorance to think you can explain either the "for" or "against" case in a few hundred words. But I stumbled onto some data that meets my "keen grasp of the obvious" threshold for understanding.
Recall that we really need to answer "yes" to four separate questions before we join the Al Gore religion of "sign the treaty immediately or we will all die."
(1) Is the globe getting warmer?
(2) If so, is man doing it?
(3) If so, is it bad?
(4) If so, is the massive-reductions-in-CO2 approach the best way to deal with it?
You might have seen such questions before, but they frequently get mixed up in public discussions. For example, some people imply that if the answer to (1) is "yes", then the answer to (4) must be "yes" as well. If the temperature graph is going up, destroy your SUV. Or at least switch light bulbs.
However, Bjorn Lomborg thinks the answers to (1) through (3) are "yes", but that the answer to (4) is "no." He once challenged Al Gore to debate that fourth question alone. But Mr. Gore treated Lomborg as he would any other global warming skeptic or "denier", comparing him to tobacco companies of old and lecturing him about arctic ice caps and sea levels.
I am not only stuck on question (2), I'm stuck on question (1). I've seen graphs of temperatures, such as the so-called "global" temperature. The UN's Intergovernmental Panel on Climate Change, for example, presents such a graph in its "Summary for Policy Makers." While this graph does present to the eyeball a rising trend, one could ask several questions.
- The total range of temperatures is within plus or minus half a degree Centigrade. Are we sure we are seeing a true trend and not just randomness?
- The total range of time is about 150 years, and the range of time in which an upward trend is apparent is perhaps the last 30 years. Is that a long enough time period to gauge a trend?
- On the other hand, looking closely at the years since 1998, the trend seems to have leveled off or even dropped. Is that too short a time to gauge a trend?
- Are the thermometers in enough places and the right places? Maybe we get too many readings from North America and too few from Antarctica, for example.
- How do you get just one number for each year? How do you take all the temperature readings from all the thermometers and all the days and hours that temperatures were read, and get a single number?
- If a computer algorithm is used to come up with the numbers, how sure are you that the algorithm did not add some artificial biases?
- How do you compare temperatures over time? Weren't thermometers added, thermometers replaced, and whole new stations included? Are earlier readings comparable with later ones?
- How do you know any given temperature reading reflects real climate, and not just what's happening near that temperature station? That is, do parking lots, buildings, air conditioners, etc. have a significant impact on thermometer readings?
- Weren't all the thermometers used to make this graph on land? Doesn't that leave out the 75% of the earth's surface that is water?
If the warming trend were stark and obvious, the questions above would be less important. But one degree in a century? I can't feel one degree. I can't find two thermometers that agree that closely. The temperature regularly changes by 20 degrees or so every day where I live. On any given day at any given time, temperatures on the earth differ by more than 100 degrees F. What is signal and what is noise?
Like I said, this is complicated. But I am willing to accept, as have most scientists including "skeptics", that the "global" temperature went up about one degree in the last 100 years.
That still doesn't answer question (1): "Is the globe getting warmer?" Unstated in the question is some sense of time scale. Warmer since last year? Since last decade? Since last century? Is it a relentless and significant upward trend imposed on minor cyclic deviations? (Answer key: No. No. Yes. And that's what James Hansen says when his muzzle is off.)
Frankly, I've seen stock market charts that look an awful lot like the IPCC temperature chart. It sure looked like the stock price was trending up relentlessly when I bought it. After that, not so much.
If I leave things at that, I'm confused, but at least find it plausible that average temperatures around the globe are going up. All based on graphs that vary within fractions of a degree over decades and centuries. (Plus arctic, but not Antarctic, ice sheet extent; polar bear counts in some regions, but not others; some glaciers shrinking, but others growing; more hurricanes some years, fewer in others; etc. You know, all that rock-solid evidence of one degree of global temperature change per century.)
But here's where the global warmists came to my rescue. They tell us that warmer temperatures lead to higher sea levels. Fortunately, there is only one ocean. And while sea levels vary with tides over the year, averages are probably fairly reliable.
As it happens, the IPCC does present a chart of sea levels and its trend is more obvious than the temperature trend. It shows a steady rise of about 200 millimeters in the last 120 years. That's about eight inches. Is eight inches over 120 years significant or alarming?
Better yet, and here is where I got my epiphany, scientists have produced a long-term graph of sea level changes, about 20,000 years worth. The graph below was taken from Wikipedia, but the data behind this graph are widely known and accepted. NASA, for example, accepts this data and the government of Canada publishes a similar graph.

First, look at the vertical scale. It ranges over about 120 meters (not millimeters), about 400 feet. On the page you see this graph, a change of 200 millimeters (or the change in the last 120 years per the IPCC) would be would be about the width of your eyelash. When the seas were 400 feet lower, people could walk from Russia to Alaska and from France to England.
We engineers have a saying: measure with a micrometer, mark with chalk, cut with an axe. That saying is meant to put things in perspective for young engineers who like to calculate things out to the number of digits visible on their calculators.
Global warmists are taking their micrometer, literally, to the last 120 years on this chart, an area that would probably fit in the upper rightmost dot on that chart. And from that, extrapolating that we are all about to die.
I no longer need to squint my eyes to see a one degree per century trend in a cloud of noisy data. The trends are stark. Thus, my epiphany.
If sea levels go along with global temperatures, as the warmists frequently remind us, then this chart makes blatantly obvious that
- Man has just about nothing to do with global temperatures,
- Any temperature changes in the last 100 years are insignificant compared to longer term changes,
- And current trends are most likely just the final flattening out of temperatures after rising from the last ice age.
How can you blame man for sea levels rising when about 99% of that rise since the last ice age occurred before man built the pyramids, much less SUVs? A rise in sea level over the last century should not be surprising; it's been rising for the last 20,000 years.
If anything, looking at this chart would convince me that long term temperatures are cyclic and that we are coming near the end of the warming part of the cycle. In fact, it looks like we are near the peak of that warming and could be about to enter the cooling-down part of the cycle.
Over the time of the chart above, man did pretty well. His population grew from fewer than 10 million to almost 7 billion. He had an agricultural revolution, an industrial revolution and an information revolution. He started cities. He started writing. He started recording his own history. He walked on the moon.
Over that time, the sea level rose about 120 meters. If the current trend continues, it will rise two meters in the next 1000 years. If man thrived like he did when the seas rose 120 meters, why would the world end if they rise another two?
Our global warming "engineers" seem eager to move to the final stage of their project: cut with an axe. Something's about to get capped all right, and not just your CO2.
Randall Hoven can be contacted at randall.hoven@gmail.com or via his web site, kulak.worldbreak.com.
on "My Global Warming Epiphany"
ATTENTION!
It has been brought to our attention that Margaret is being portrayed as a psychic on $1.99 sites. These sites are doing so without Margaret's permission. Margaret has not claimed she is a psychic. - MW